Digital Darkroom: Setting the Levels
 Long post warning: But if you are into digital photography it is probably worth a read. Also there is a picture of seriously cute niece included.
Semi-large pictures warning: Some of the embedded pictures may take a few extra seconds to load as they are up to 100KB in size—which is not big, but big enough to take a bit longer to load.
If they have exposure problems then adjusting the levels can transform your images.
This is the third, and second last, instalment in my Digital Darkroom 101 basics series. This instalment covers ‘setting the levels’—which is really ‘setting-the-brightness-or-darkness-levels'—but nobody ever says it like that. Some people refer to this as ‘setting the blacks and whites’, ‘normalising the histogram’, or ‘closing the histogram’. Whichever it is called it is all the same thing and is simply about making sure that the degree of picture information between dead black (no light) and pure white (fully lit) is distributed evenly as possible across the black-to-white range of the combined RGB (Red, Green, Blue) histogram—which is sometimes called the ‘master’ histogram or the luminosity histogram.
In a modern digital camera, even a less sophisticated point-and-shoot camera, the built in computers will generally do a reasonably good job of setting the exposure correctly for each photograph taken and produce reasonable quality JPG image files. The combined histogram for a well exposed photograph should show the photograph information starting to curve up at left-hand side of the histrogram, peaking into one or more curves in the body of the histogram, and then tailing off on the fully-lit right hand side. The following three histograms are from well exposed photographs.
In each of these the bulk of the detail in the photograph is within the bounds of the histogram. Based on these histograms, nothing, or at least not a lot, of detail has been lost to total blackness on the left-hand side, or to total white out on the right-hand side.
Correcting levels for under-exposed photographs
[Note: The following examples were edited using Adobe PhotoShop Elements]
A histogram that shows the photograph information bunched up to one side indicates a photograph that probably needs some adjusting to bring it up to its full potential; in relation to the exposure and lighting.
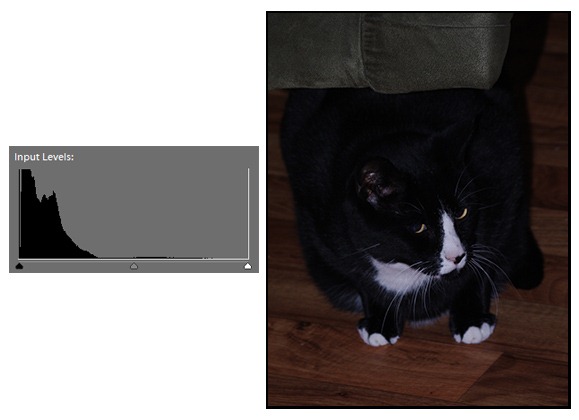
The following histogram is of a picture of our cat Jazz sitting under a chair. This photograph was taken with the flash purposely set to under-expose by one stop. Observe the following histogram and picture.

Due to the lack of camera flash light the histogram is all bunched up over on the dark side (so to speak). It is all over to the left, and this is not to be unexpected because the picture is of a more-or-less black cat, on a dark brown floor, under a dark green chair. It is all ‘dark’. But we can pick this picture up by moving the right-hand side slider over to the left, thereby effectively ‘pulling’ the picture more into the middle of the new histogram.
Following is the same picture with the histogram adjusted so that the information about the photograph is distributed a little more to the right.
Note the difference in the picture now. It has much more snap and detail.
All I did was move the white-point marker in the histogram to the left. This tells the photo editor (in this case Adobe PhotoShop Elements) that anything where the new white-point marker has been moved to should now be considered to be pure white; and to drop off (cuf off) anything east (to the right) of the new white-point marker.
The second histogram shows the outcome of doing this. The photograph information ‘curve’ now extends further to the right—in fact it now extends past the mid-way marker whereas before it was all in the first quarter of the histogram.
The question could be asked: “Why not move the white-point marker all the way up to the start of the bottom of the curve?” This is what you would normally do. But doing this for this picture totally ‘blows’ the whites. What this means—blowing the whites—is that any detail in the whites on the cat get lost. They end up to the east of the white-point marker and therefore get deleted from the picture information.
The following picture shows what happened when the white-point marker was moved right up to what appears to be the start of the information in the histogram.
To some this picture may look better but there is now no detail left in the white parts of the cat. Also, the cat’s jet black fur is beginning to look a little dark grey to blue-ish. As well, the brown floor is going marginally red.
So while adjusting the histogram generally means moving either the white- or the black-marker up to where the picture information starts, you also need to see what is happening to the picture for those cases where doing this may not produce a good outcome.
Featuring seriously cute niece (SCN) here is a another, less extreme, example of using the histrogram levels as one way of improving a photograph.
The picture at left is how the camera processed this shot of SCN and put the JPG on the memory card. As you can see from the histogram underneath the picture the white-point is some distance away from where the information for the photograph seems to stop. In the second picture the white-point marker has been moved to the left to bring it closer to where the actual white-point probably is in the case of this photograph. Nothing else has been changed in the second picture—no colour enhancing, no sharpening (unsharpening), no shadow/highlight changes, nothing. Only the levels were adjusted.
Correcting levels for over-exposed photographs
[Note: The following examples were edited using Corel PhotoPaint X3]
The following photograph was purposely taken over-exposed by 1.3 stops in order to obtain a right-side histogram.

The histogram clearly shows that the bulk of the information for this photograph is over to the white side with just a modicum of information—for the yellow flowers and the cream wall in the background—tailing off over to the dark side. But because the histogram is so pushed over to the white side there is little or no detail in the white flowers.
By using levels to move the dark-side slider over towards the right a bit we can get some detail back into the white flowers, and also, to a lesser degree, into the yellow flowers.
This does make the picture darker overall, as would be expected, but we do now have some useful detail showing in the white petals. Obviously no amount of slider movement will recover blown white detail—as this was permanently lost once the image was converted to a JPG an put onto the memory card. Moving the slider further does not recover more detail—it just makes the image get darker.
The key thing is to work out where the optimum point is to set the dark-side slider.
Well that is about the end of my basic introduction to setting levels.
There is much much more that can be said, and there is much more that can be gleaned out of histograms once you come to know what they are telling you. Here I have only discussed the combined RGB histogram and changing this, but in most image editing packages you can individually slide the red, green, and blue sliders in the histogram. Also we have only worked with post-camera JPG images. Working with camera RAW images (a.k.a. digital negatives) opens up a whole other tomb of amazing options. So, if seeing what the basic combined RGB slider can do for your photographs has inspired you then I encourage you to use Google or Bing to seek out some of the many sites on the web that will take you deeper into working with histograms and digital negatives (RAW images).
My next Digital Darkroom post is the last one I planned in the series and will cover sharpening (er, unsharpening) and resizing for print and Web.


